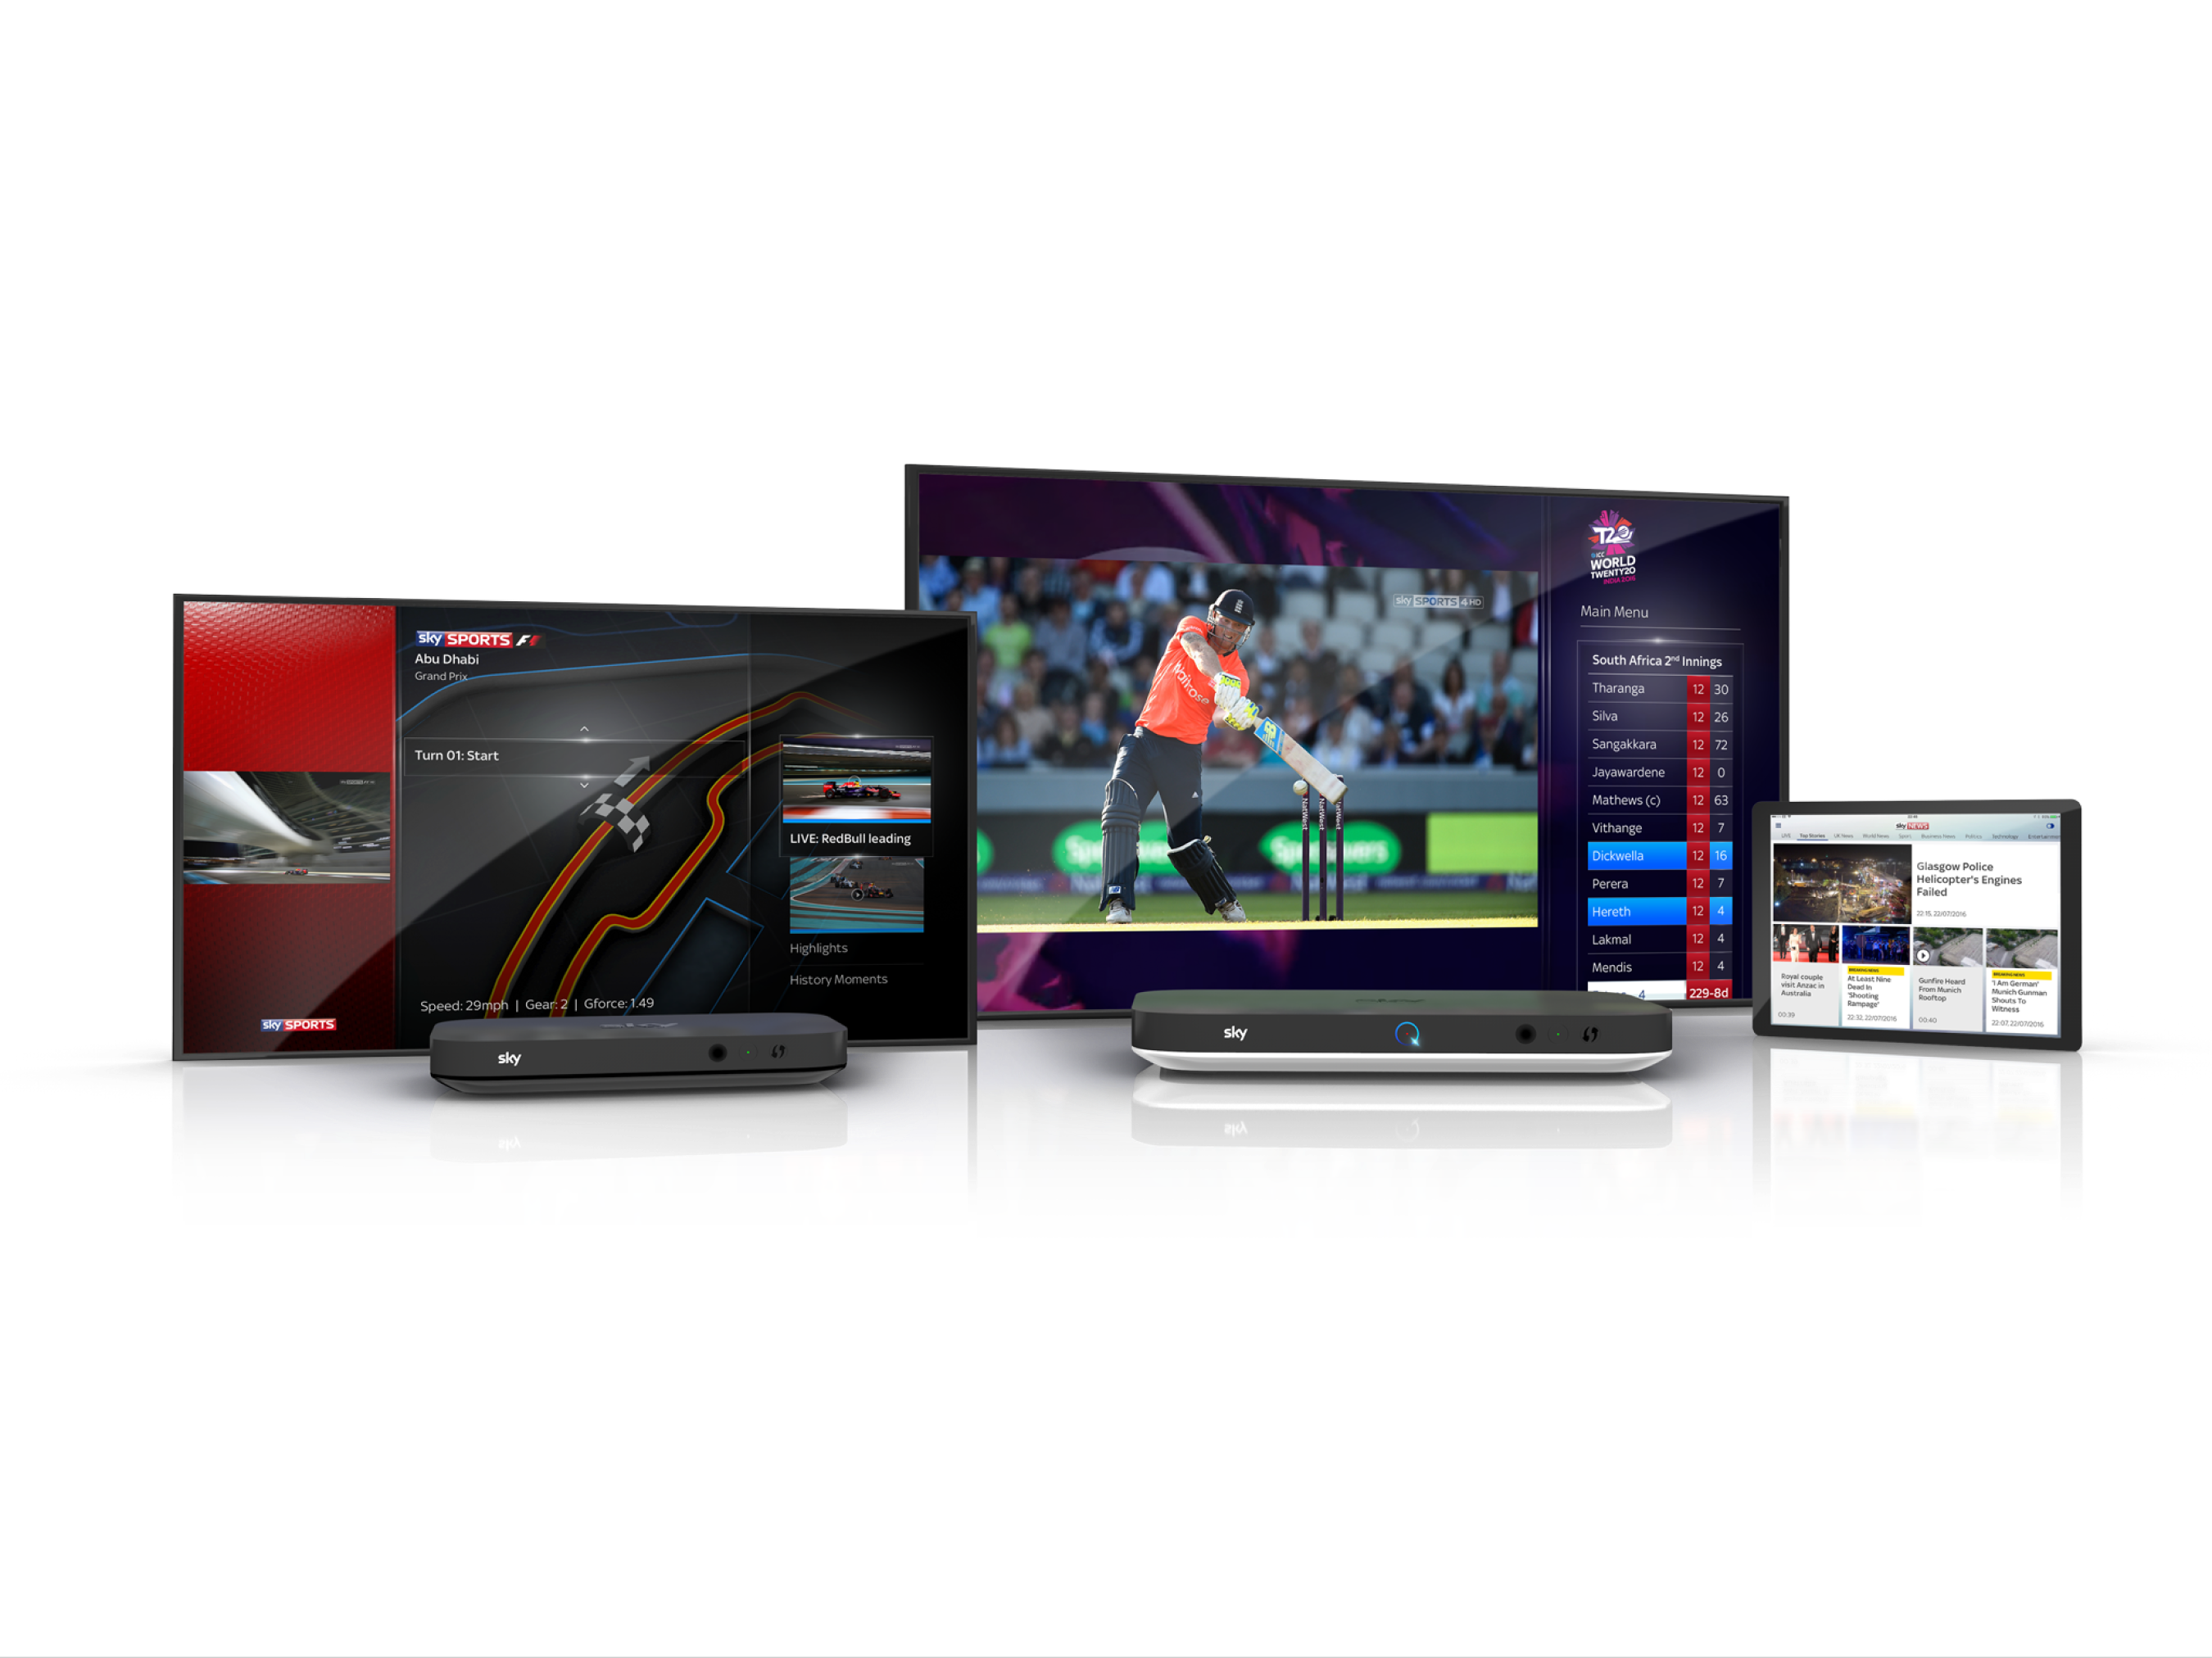
The aim of “enhanced live" was to build a light yet robust proposition that could support data, graphics and VoD clips to enrich the TV LIVE experience in the 21st century.
The Red Button was historically about enhancing the live experience – right when the data come in.

The SkyQ Design Team challenged themselves to deliver a scalable sports proposition. A framework for apps and additional streaming services supporting the Center of Digital Home™ (CoHD™) offering.
Landscape
Next Generation of
Enhanced Live.
Effect
Follow your favourite sports with fluid viewing and reach the full potential of your digital experience through SkyQ.
Experience
The Challenge.
With many sporting events each year, Sky Sports faced the challenge of integrating LIVE, VoD and stats into one single comprehensive, scalable experience.
01
Customisation
With over 30 LIVE events a year across five channels, Sky Sports brings a combination of LIVE broadcasts, VoD and OPTA stats. It means a production team has full control over a robust platform, allowing them to customise the LIVE app for any event.
02
Integration
The greater challenge was integrating the SkyQ with existing Sky services to deliver content across different touchpoints. Sky Sports News HQ (SSNHQ) is the first fully integrated platform to utilise a whole spectrum of OPTA data feeds.
03
Scalability
One of the mandatory requirements was scalability. This challenge became the primary focus for the design team throughout the full integration. All the components were designed to be interchangeable and to accommodate further data expansion.
Supporting
Enhanced
Live.
Note
Football, tennis, rugby, golf and Formula 1 are unique events. Our guiding principle was to build a fully customisable platform while ensuring that complex scenarios such as feeding content from multiple football leagues simultaneously are handled from a data perspective with an intervention of the programme operator.

Expereince
skyOS:
Data Model.
Effect
A spatial model allows the user to simultaneously navigate between different experiences without losing their connection with live TV and dynamic data.
LIVE vs VoD Clips
01.
A spatial model allows the user to simultaneously navigate between different experiences without losing their connection with live TV and dynamic data.
Data and APIs
02.
The modern world of sports is built on various data streams and APIs that allows providers to tailor their feeds. These become narratives through a series of connections, dependencies, links and facts, creating a holistic picture of any event.
3D
02.
Out of all the data, we tested, the most impactful was the Formula 1 3D proposition. This can visualise the driver's position on the circuit and allow viewers to see through the eyes of the driver
Effect
04.
Once all the data was collected, we provided a secure stream of our package that could be rendered on our customers' screens. The technology that made all this possible is the next generation of 3D experiences inside of CODH™.
Expereince
The Production
Date Flow.

Instant Access
One Swipe Away.
The entire experience was designed with the mindset that all information should be one swipe away.
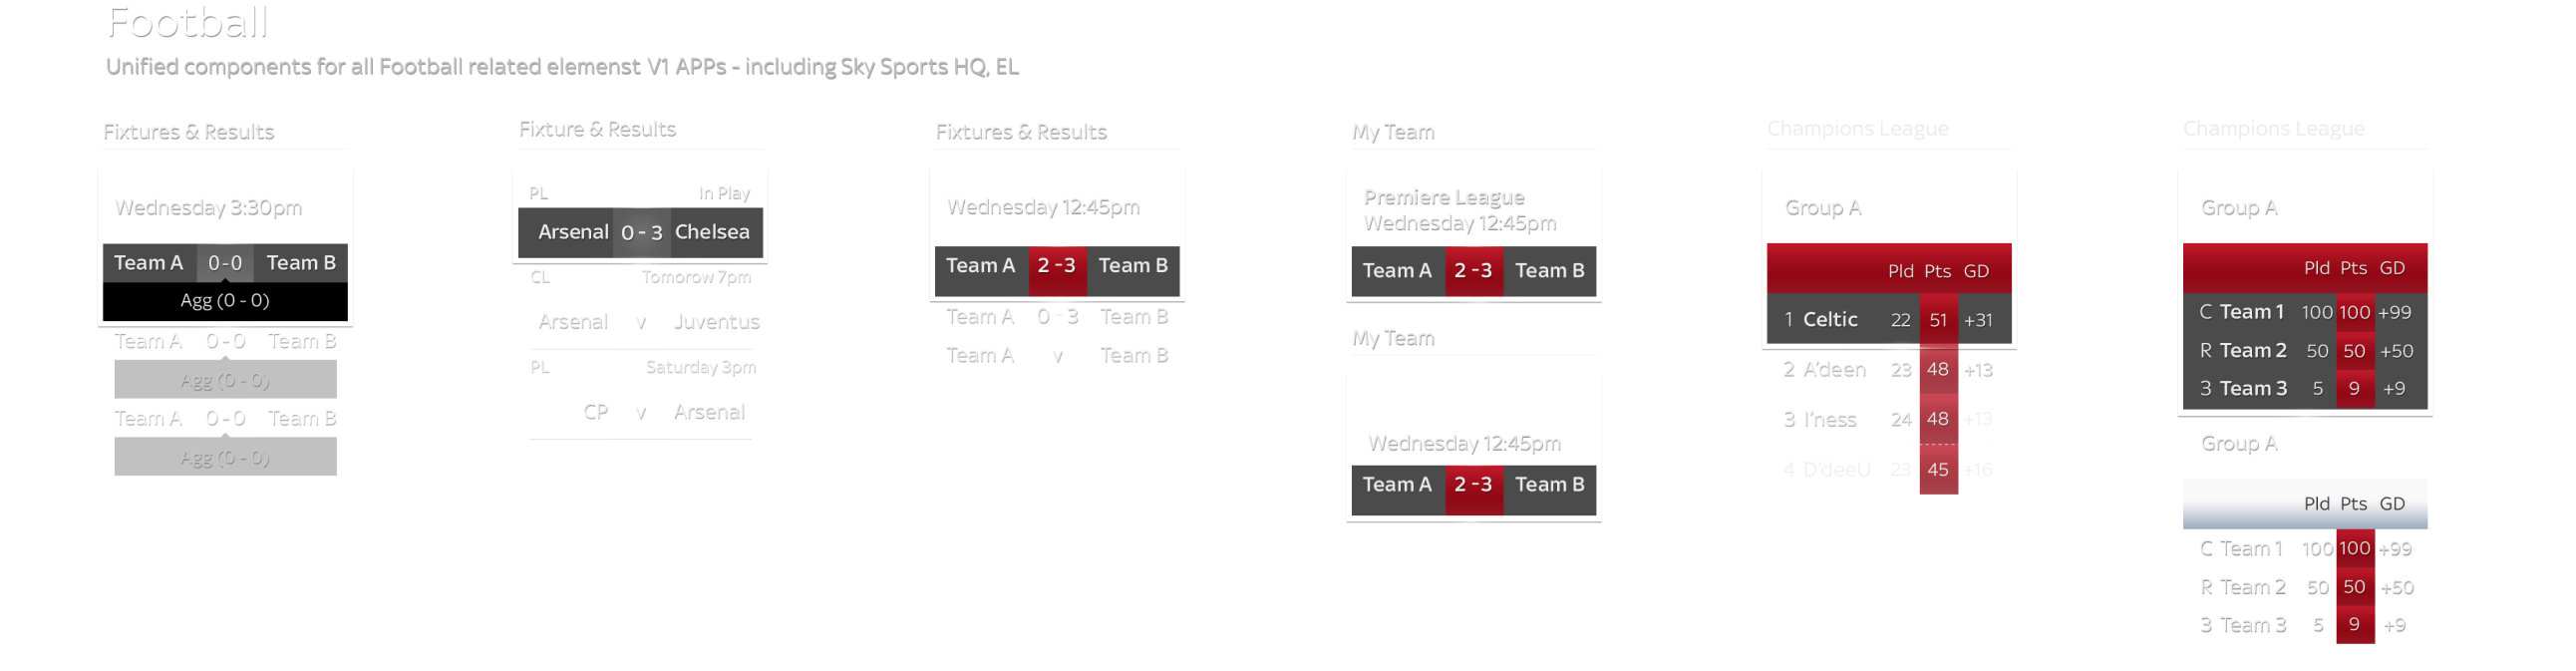
Scores Unbound
Scores and Tables Unbound.
All data had to be visualised to support LIVE views. For that, we developed three data views.
Customisation
Customise Your Team.
The most popular feature was to add your own team or player to the main menu. This meant customers were one click away from your favourite team.
Expereince
A Unified
Experience.
Effect
Framework unification can limit creative output. We designed a three-layered system that supports data unification, operational integration and unlimited skinning capabilities. This replaced a minimum amount of components for the operations team can use to generate the LIVE view.

Design Specific
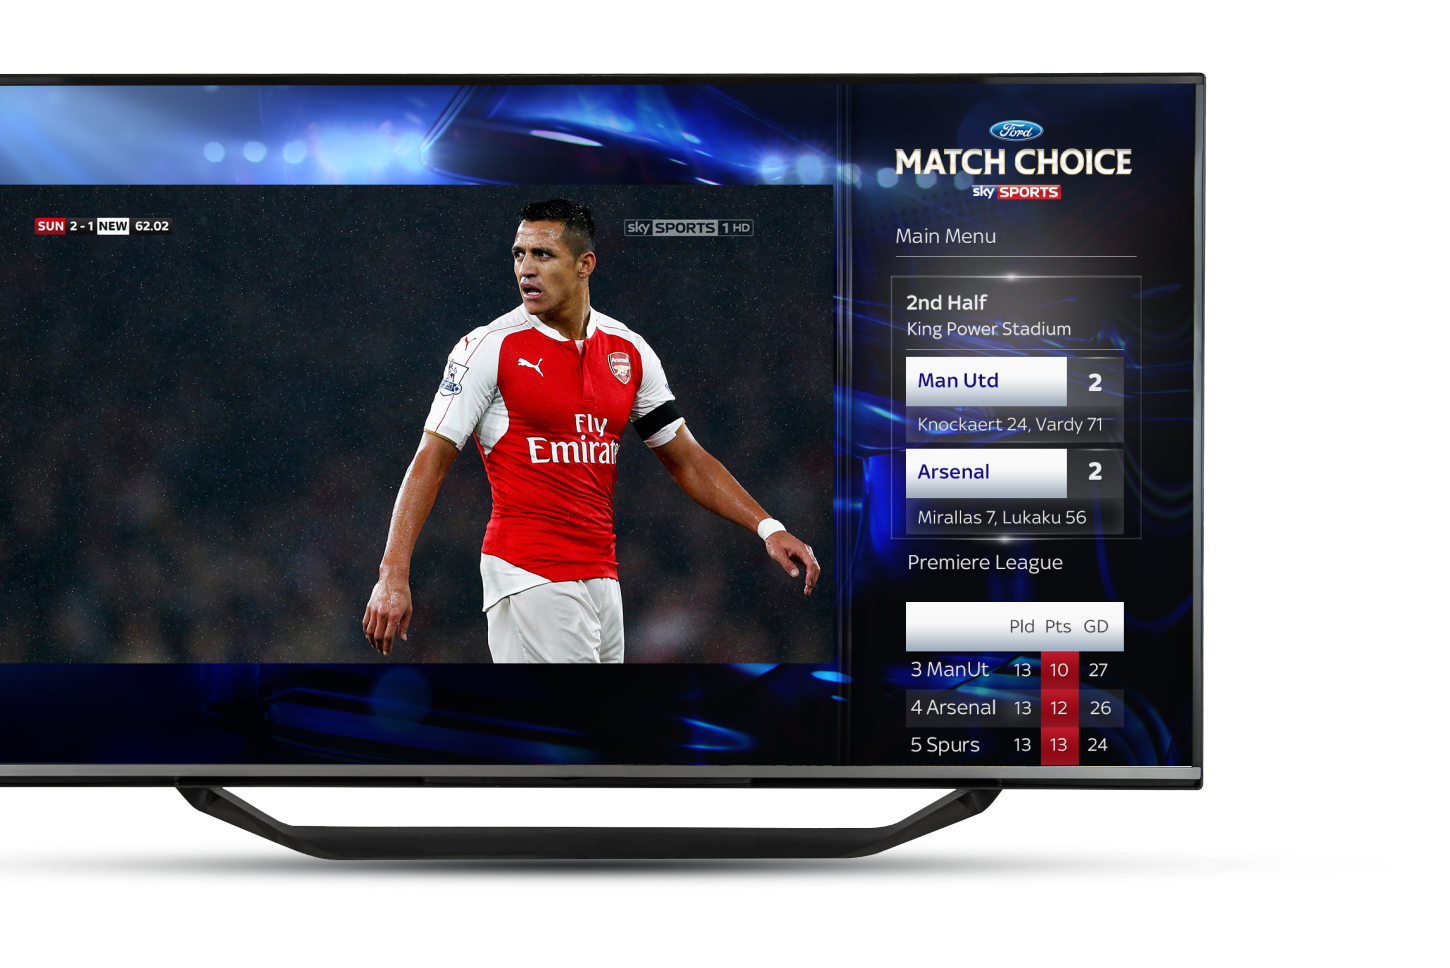
Football
Live.
Whether you are watching the Premier League, the Championship league, La Liga or the World Cup, our App is ready to support your viewing experience.
Ecosystem
All the components were able to display real-time stats before, during, and after a game (Scheduled, in Play and Final Time). As you can see, without exception, we also could display who scored and at what time.
Design Specific
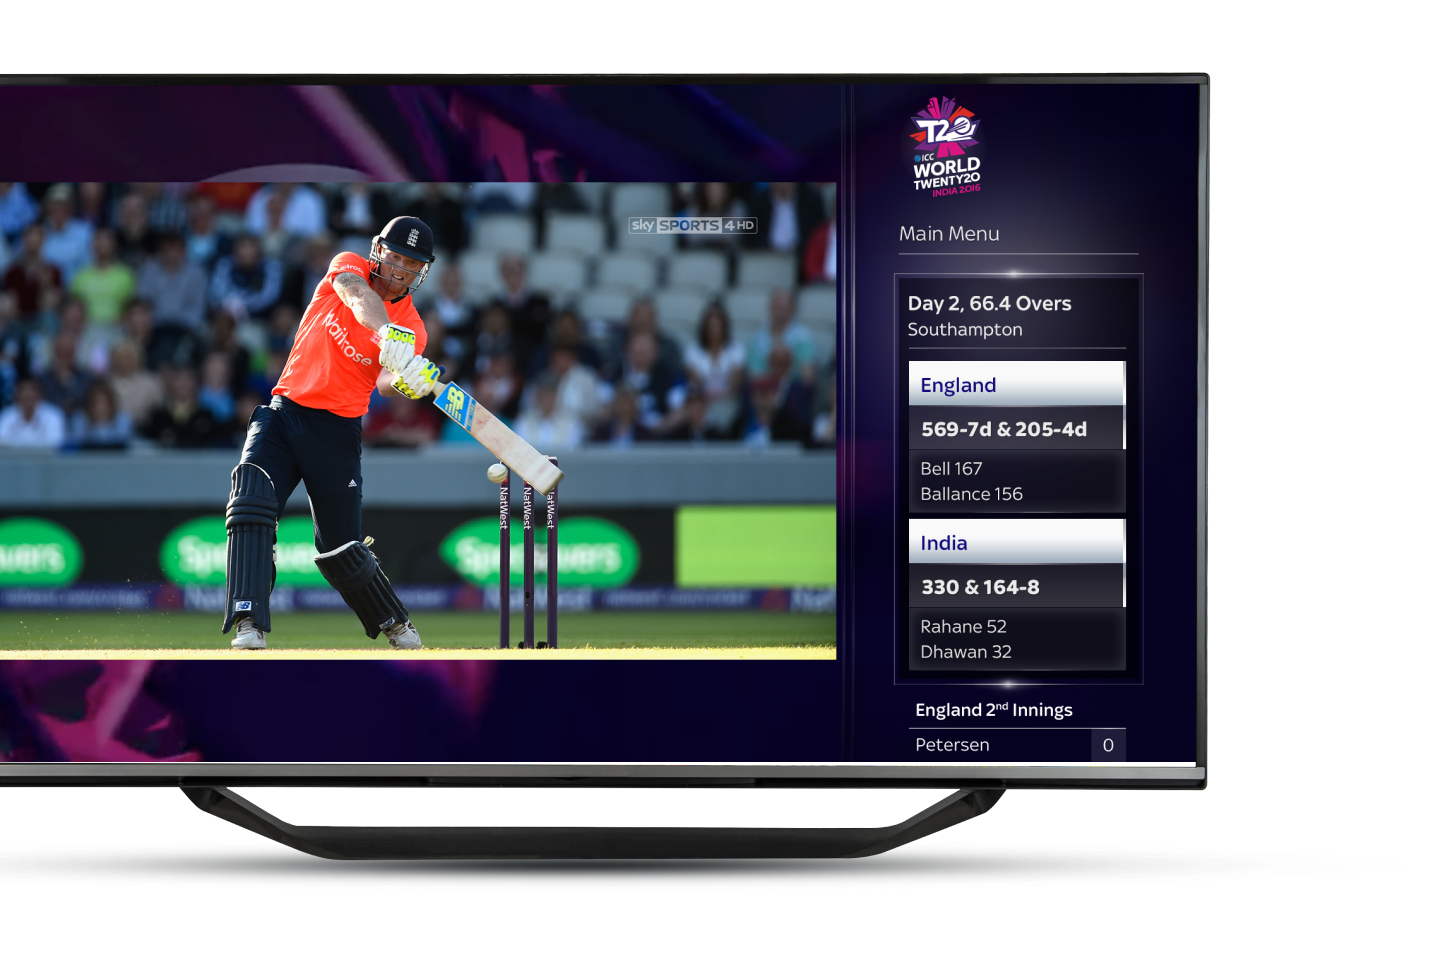
Cricket
Live.
Cricket is one of the most complicated games in terms of its rules. We worked with Cricket specialists to display all game data, so when watching the Twenty20 series, you can have all the game data on one screen.
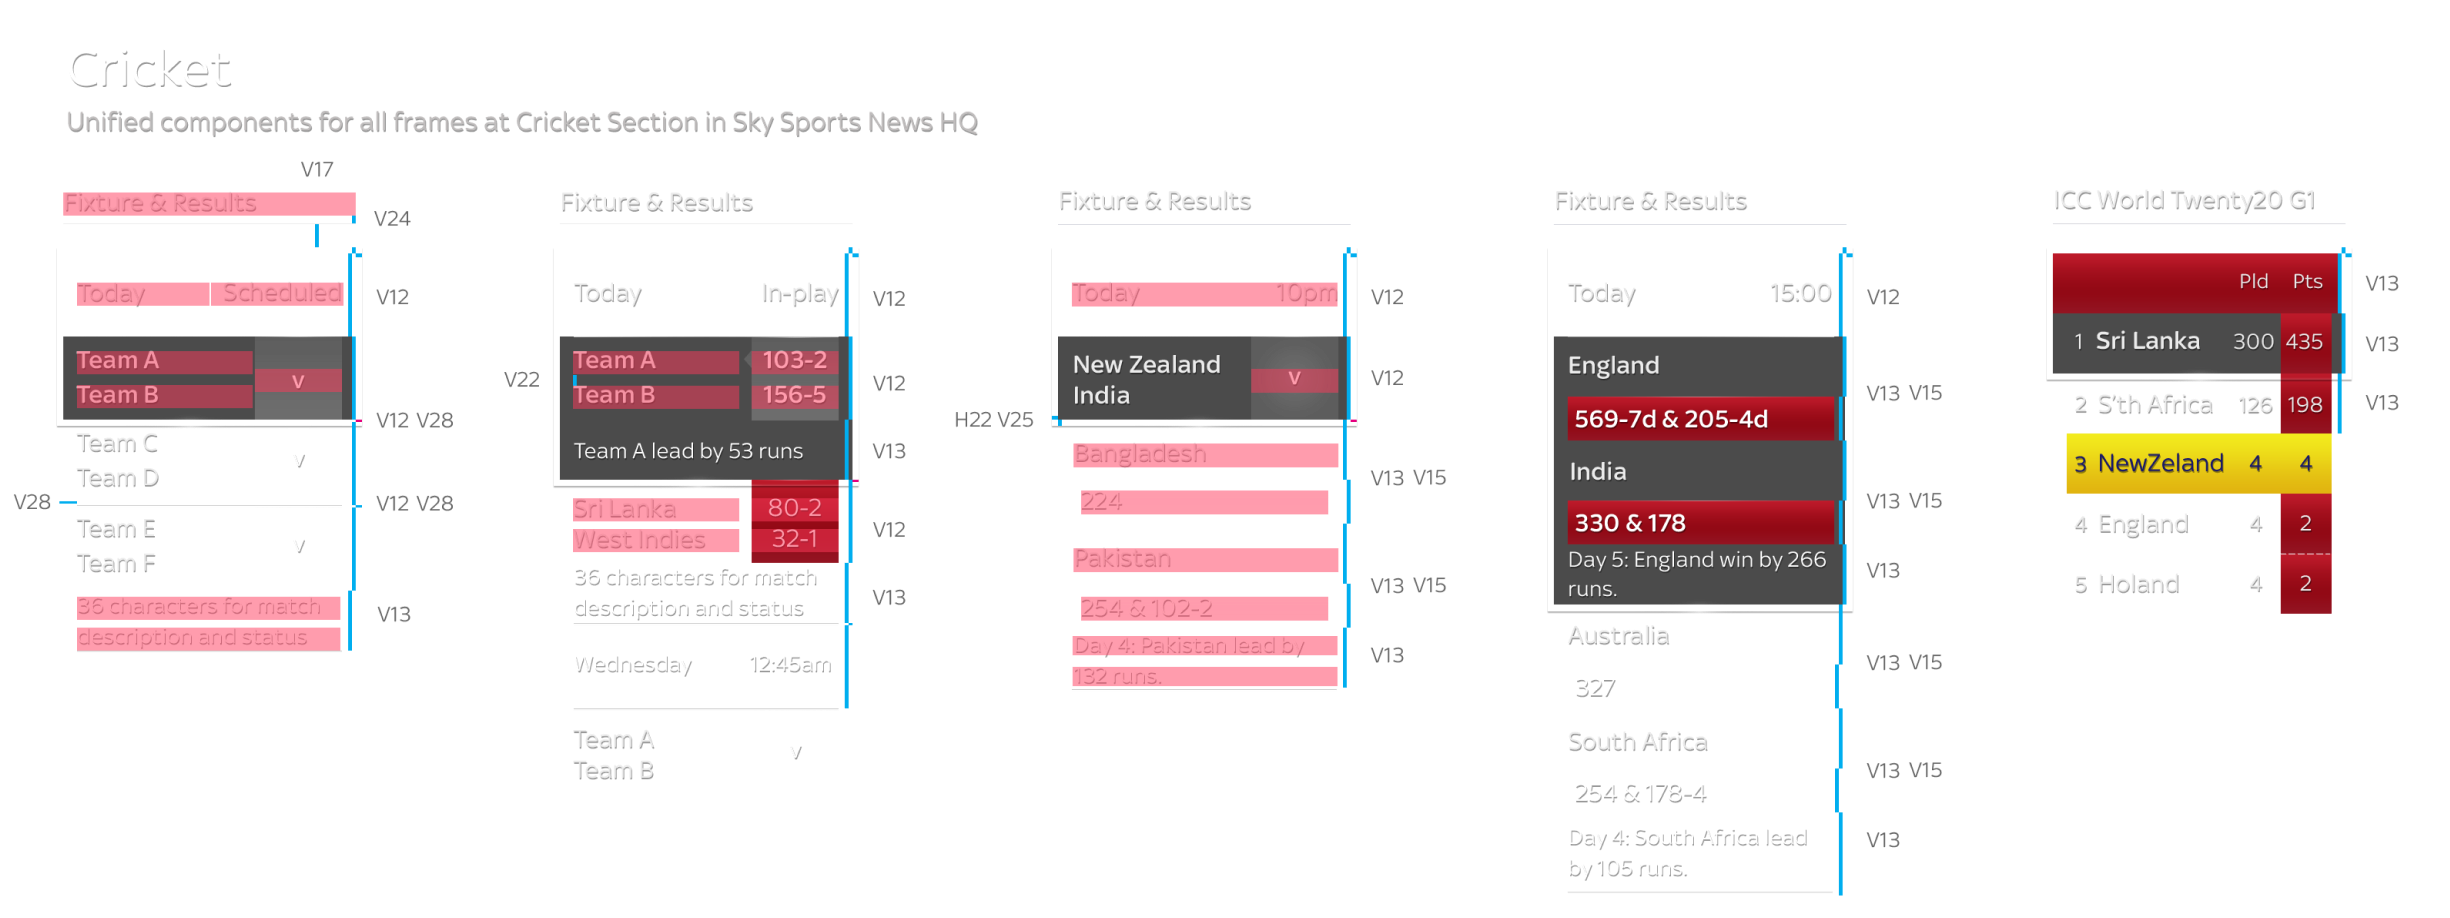
Ecosystem
Below are some examples of how we manage to fit the game data into a very small space to communicate essential information about the game, even tea time.
Design Specific
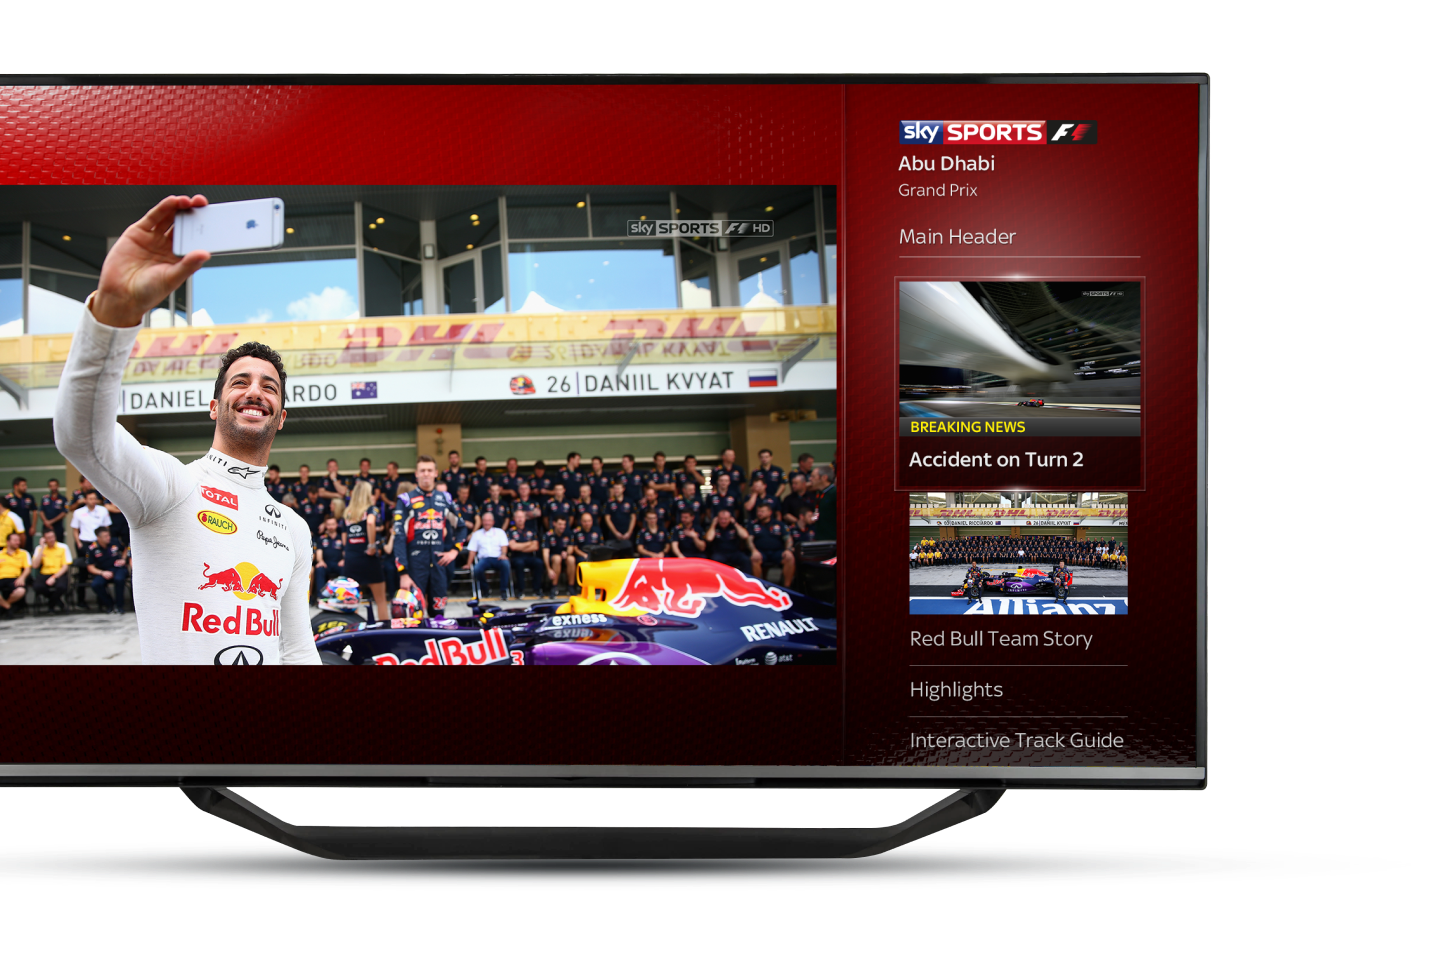
Formula1
Live.
This App used a different structure but with consistent branding. The F1 App was one of the first to use our bespoke 3D interactive modelling.
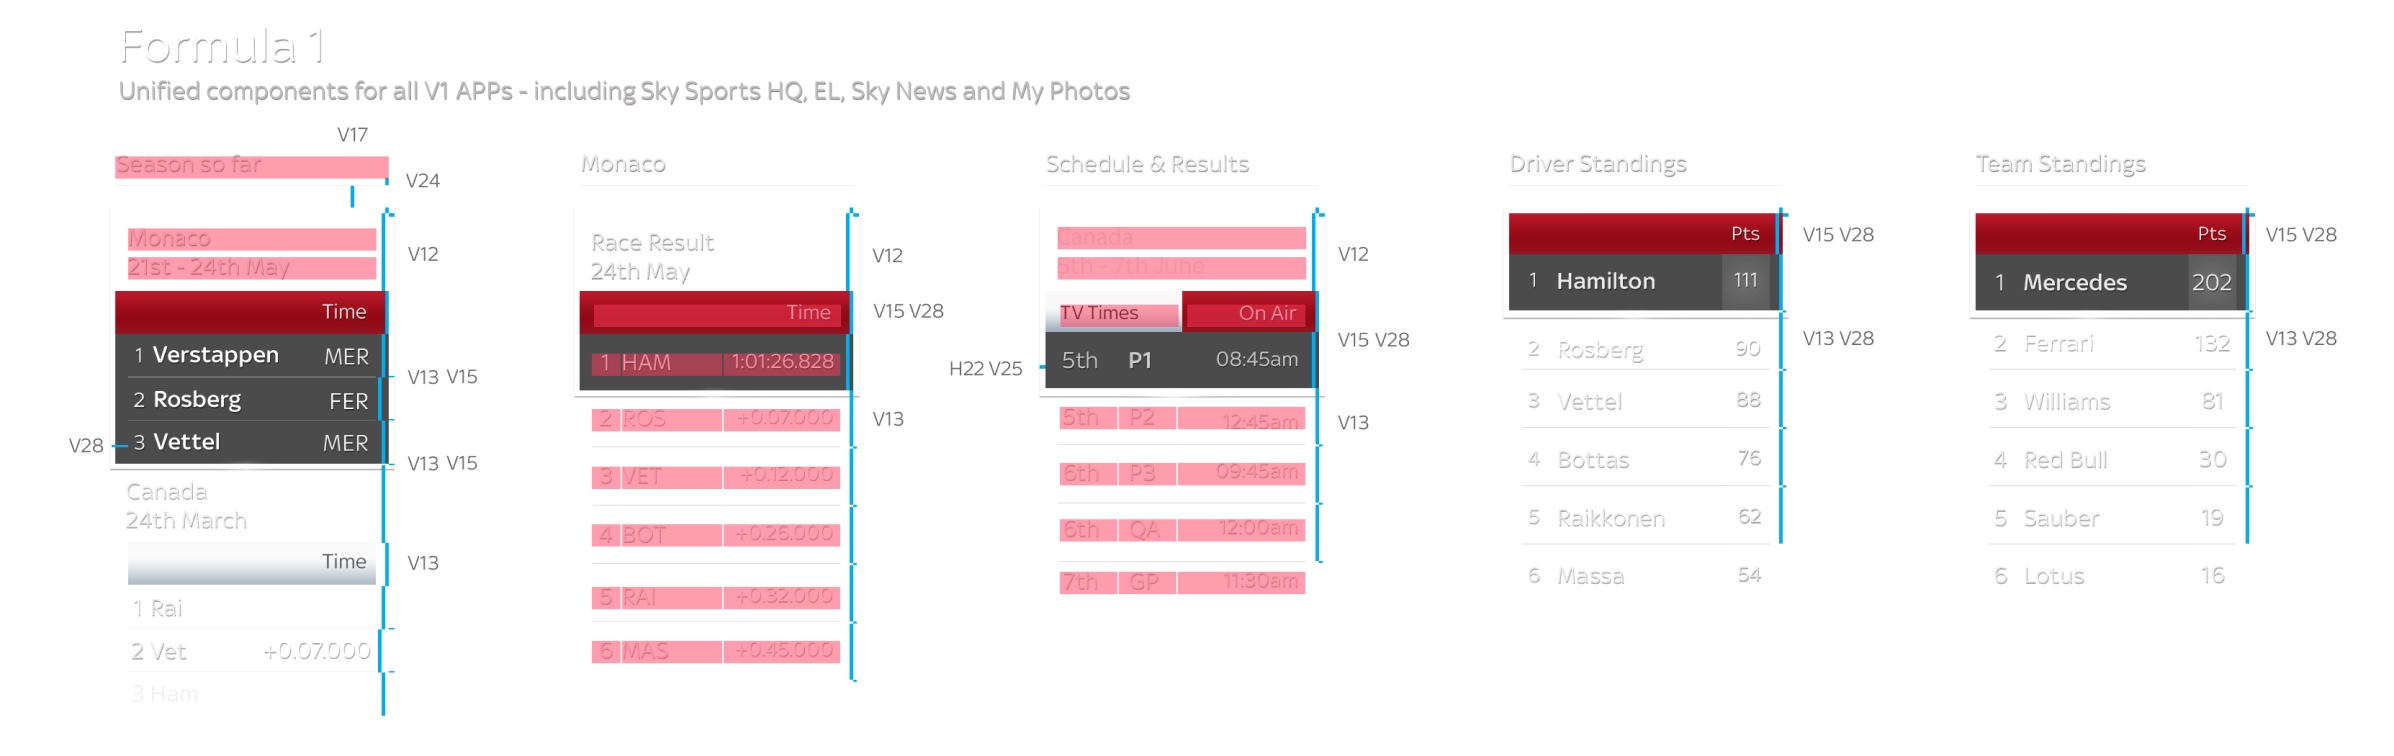
Ecosystem
Each sport has different important stats. F1 fans, for example, want to see racing time, positions and the next race location, whereas football or cricket fans want to see such stats as shots on goal, possession, overs, balls, runs, etc.
Why
Product Design Delivery at Scale.
Method
Design
Methods.
2000 - 2022
Confluence
The Customer Experience team together with talented BAs created Design Hubs where we shared all information. The hubs allowed us to collect our High-Level Requirements (HLRs), User Acceptance Criteria (UAC), System-Level Requirements (SLRs), as well as the design prototypes and all their iterations. An easily trackable and sharable environment allowed us to move faster and smarter.

Jira
Atlassian's JIRA helped me organise work across the three teams and 30+ projects. Together with CSM® and powerful Jira Query Language (JQL), we created dashboards that operated and informed stakeholders about the current situation, velocity and how we were delivering value to the business.
People
The Sky Q Apps
Product Team.
2013 – 2016

Anthony D.
Group Director

Davide T.
CPO® Apps

Jeremmy W.
CPO® Sky Sports

Joel B.
Creative Director

Jiri M.
CX Director Apps

Matt C.
Design Director Core

Sam B.
CSM®

Matt P.
Copywriter

Adelaide L.
UI Designer

Ashley B.
UI Designer

Anneke G.
UI Designer

Adny C.
UI Designer
Impact
Impact of Design on the Product Delivery.
Overall
Budget.
50m
We have launched the product earlier than originally estimated, which has a significant pack on operational cost
Design
Function Saved.
16m
DaS implementation saved on operational and management costs as we don’t need to spend additional reporting.
Impact on
the Business.
32%
From the project initiation to final delivery the overall impact on the business including team cost, operation, development and integration was about 32%
* All great teams operate on a simple family model. Across the multicultural and multidiscipline teams, we all have families and understand our roles in these groups. Translating that correctly to the team makes a significant difference to the tribe and their outcome.
To a tailored list of meaningful snippets that help design
leaders manage their daily challenges at scale.
All brands and trademarks presented on Design at Scale™ website are owned by their relevant companies or agencies. The projects represent collaborations between designers, developers and product owners. Do not copy or publish any of the projects shown here without writen approval from Design at Scale™ (alternatively GIVE™, 9V™) and/or relevant companies and agencies.